Authors:
Sotiris Papadelis (HEBES Intelligence)
Filippos Anagnostopoulos (IEECP – Institute for European Energy and Climate Policy)
Note: opinions in the articles are of the authors only and do not necessarily reflect the opinion of the EU.
Measurement and verification (M&V) of energy savings is fundamentally an impact assessment problem, where the goal is to estimate the counterfactual energy consumption, i.e., what would the energy consumption of a building have been had an energy efficiency intervention not occurred. Different M&V methods and tools are already employed for the support of energy efficiency interventions that are implemented through Energy Performance Contracts (EPC). However, if the goal is to increase the scope and/or scale of EPC, new M&V methods are needed that:
Are fully data-driven and require as little human-in-the-loop intervention as possible. Creating customised models that are tailored to specific buildings is expensive when dealing with large portfolios of buildings.
Can easily adapt to changes in the occupancy schedules and/or the intensity of occupancy (i.e., number of people or level of plug loads that correspond to full occupancy).
The SENSEI project has contributed to both directions by developing and open-sourcing the innovative M&V approach that is described in this article.
The predictive approach to M&V
The most common approach to M&V of energy savings from a retrofit is to treat M&V as a prediction task. In this case, a predictive model is developed using the pre-retrofit data to predict the building’s energy consumption. Two sources of information are used for the development of this model:
1. Occupancy-dependent information. Energy consumption reflects events and operations that take place inside the building and, as a result, recurrent events and routine operations lead to daily, weekly, and yearly seasonality in consumption that can be exploited. In most cases, occupancy-dependent information is captured by calendar features (as a proxy for the operation schedule), such as the week of the year and the hour of the week.
2. Occupancy-independent information that was predictive of the building’s energy consumption prior to the intervention. The most often utilised information is the outdoor air temperature.
After the energy retrofit, this model is used to predict the counterfactual consumption. The difference between the counterfactual and the actual consumption is regarded as avoided energy usage that can be attributed to the intervention. This approach is summarised in Figure 1, where:
Baseline period is the period of time prior to the intervention during which data is gathered so as to determine the relationship between energy consumption and the different independent variables that can predict it.
Reporting period is the period of time following the intervention during which data is gathered so as to calculate energy savings (avoided energy use).
The observed variables include weather data and calendar features.
The unobserved variables include the operation schedule and the energy consumption density (for instance, plug loads at maximum occupancy levels).

Figure 1. M&V as a prediction task
Adapting to changes in the characteristics of the building’s energy consumption
The two main assumptions behind the predictive approach are that:
All the aspects of the building's operation that are approximated through the calendar features (first and foremost the operating schedule) remain the same during the post-intervention period.
The characteristics (in the sense of the conditional distributions) of all the unobserved variables that have not been used for the training of the predictive model also remain the same during the post-intervention period.
However, buildings are complex, dynamic systems, and we should not expect these assumptions to hold for a long time after an intervention. When these assumptions no longer hold (due to changes in the way the building is used) the predictive model becomes irrelevant and must be corrected. One way to correct the predictive model is through the chaining method for non-routine adjustments that was proposed by the International Performance Measurement and Verification Protocol (IPMPV) (EVO 10400-1:2020).
Chaining requires the ability to monitor energy consumption after the energy efficiency intervention and infer potential changes in the unobserved variables. If changes are detected, a new predictive model is deployed with the goal of quantifying the impact of these changes. The counterfactual consumption during the reporting period is estimated as the impact of the intervention corrected for the impact of the change in the unobserved variables. This approach is summarised in Figure 2.
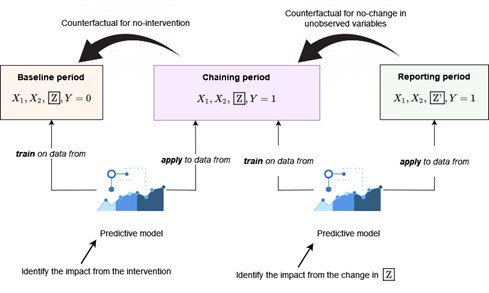
Figure 2. The chaining method for correcting predictive models
The chaining method is meant to run when an event that alters the characteristics of the building's energy consumption is known or detected. If we consider that an energy efficiency intervention is a known event that alters the characteristics of the building's energy consumption, we could imagine a M&V approach that corrects/updates the M&V model as soon as we get enough data from the post-intervention period. This is the approach that the SENSEI methodology adopts for M&V, a unified chaining method that adapts the M&V model after any known or detected event, including the event of the energy retrofit itself.
Event detection is an area of active research both for M&V and for predictive model development and evaluation in general. Typically, the terms data drift and model drift are used in the machine learning domain to indicate cases where the distribution of the input data or the relationship between the input data and the model’s target change over time. Event detection is not in the scope of the SENSEI methodology.
The SENSEI methodology for M&V
The SENSEI methodology for M&V defines the M&V goal as one of devising and applying mapping from states and conditions after an energy efficiency intervention, to states and conditions before it. The impact of the intervention is the difference in energy consumption between matching states and conditions. To this end, the proposed methodology makes a distinction between mapping variables and impact variables:
Mapping variables are defined as the observed and/or unobserved variables that must be similar between the pre- and the post-event periods so that a counterfactual estimation would make sense. In other words, mapping variables help us in mapping from states and conditions after the event/intervention to states and conditions before it. The weather, the building's occupancy schedule and the intensity of the occupancy (i.e., number of people or level of plug loads that correspond to full occupancy) are examples of mapping variables. Since mapping variables do not reflect the ‘structural’ energy efficiency of a building that M&V is accounting for, an M&V model must be able to adapt to changes in these variables. The SENSEI methodology is able to explicitly capture changes in mapping variables, so it can also be used when these changes are of primary interest (such as demand response applications).
Impact variables are defined as the unobserved variables that directly affect the impact of the energy efficiency intervention. The U-value of the building's envelope, as well as the efficiency and/or the control strategy of the HVAC system are examples of impact variables.
The interrelation between mapping and impact variables can be summarised using the simplified building model in the following diagram:

Figure 3. Simplified building model
Figure 3. shows that the energy consumption of a building can be described by two groups of values:
A hidden mapping variable called activity levels, which reflects occupancy levels and occupancy schedules indirectly through the variability of consumption under similar external conditions (defined by occupancy-independent variables, for instance, similar outdoor temperatures).
The impact variables that affect the energy consumption given the activity levels and the external conditions.
The main idea behind the SENSEI M&V methodology is that we can have a valid, counterfactual prediction model by comparing the energy consumption before and after an intervention for similar activity levels and similar values of occupancy-independent variables (for instance, similar outdoor temperatures). The general rules of the methodology are outlined next.
Counterfactual predictions for impact variables
For events that affect impact variables (such as an energy retrofit), counterfactual predictions require the following steps:
First, the pre-event activity levels are estimated.
Then, a consumption predictive model is trained on pre-event activity levels and occupancy-independent variables.
Finally, post-event activity levels are estimated, and the predictive model is used to create counterfactual predictions given the post-event activity levels and occupancy-independent variables.
The best way to describe the proposed M&V modelling approach is as a combination of autoencoders. One autoencoder model is developed using pre-retrofit data, it uses energy consumption data to identify activity levels conditioned on the occupancy-independent features (encoder) and then uses the activity levels and the occupancy-independent features to reconstruct the energy consumption (decoder). The other autoencoder model is developed similarly using post-retrofit data. Then the M&V model is derived by combining the activity estimation of the post-retrofit data (second encoder) with the energy consumption model that was trained using the pre-retrofit data (first decoder). This concept is summarised in Figure 4.
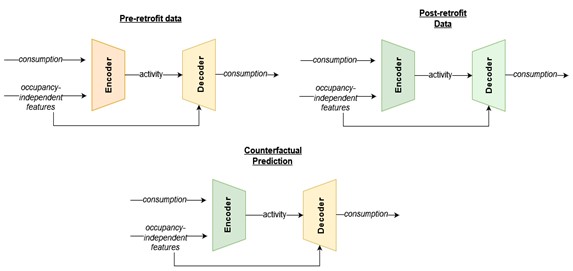
Figure 4. The autoencoding approach to M&V
Conceptually, this process is similar to clustering both the pre- and the post-retrofit data into bins of similar activity levels and similar values of the occupancy-independent variables (such as outdoor temperature). The impact of the intervention is then quantified by comparing similar bins before and after the intervention. This is pretty much how a counterfactual prediction should work: find similar conditions between the two datasets (for instance, similar outdoor temperature and activity levels), and compare their energy consumption.
There are two main benefits from the proposed approach:
The autoencoding approach ignores changes in energy consumption that can be accounted for by changes in activity levels. This is useful because energy efficiency interventions do not change activity levels, and changes in activity levels should not be attributed to energy efficiency improvements. This also means that the model can automatically adapt to changes in the building’s operating schedule.
It can deal with intermittent (lumpy, volatile, and/or unpredictable) energy consumption, where we cannot easily predict when it is going to be larger than zero. Typically, intermittent demand includes many zero values. Activity levels are a natural way to cluster energy consumption and compare similar states before and after an intervention. Accordingly, the SENSEI strategy for intermittent demand data is to estimate the impact of an intervention using the observations with the highest activity levels and then, interpolate the impact over the remaining observations (assuming zero impact for zero activity levels).
Counterfactual predictions for mapping variables
For events that affect mapping variables (such as fewer people using the building due to restrictions imposed to deal with the COVID 19 pandemic), the pre-event consumption predictive model is used to estimate post-event activity levels. This is done by finding the activity levels that force the output of the (pre-event predictive) model to match the currently observed energy consumption. Note that if only mapping variables have changed, the consumption model is still accurate when predicting energy consumption. The pre-event consumption predictive model is then used to create counterfactual predictions given the post-event activity levels and occupancy-independent variables.
Events that affect both impact and mapping variables at the same time, for instance, upgrading the HVAC system and reducing the maximum number of people in the building (when plug loads are directly proportional to that number), can be very problematic no matter how smart an M&V methodology is. Unless sub-metering or other additional sources of information are available, these events imply bad design and/or execution of the M&V plan.
The eensight tool
The SENSEI methodology for M&V has been implemented in the open-source tool eensight. There are three namespaces in eensight:
train | Datasets and pipelines that exist in the train namespace are used for baseline model training. |
test | Datasets and pipelines that exist in the test namespace are used for baseline model evaluation. |
apply | Datasets and pipelines that exist in the apply namespace are used for counterfactual prediction (the reporting period). This means that, by convention, if an event that alters the characteristics of the energy consumption (such as an energy retrofit) has taken place, the post-event data should be in the apply namespace. |
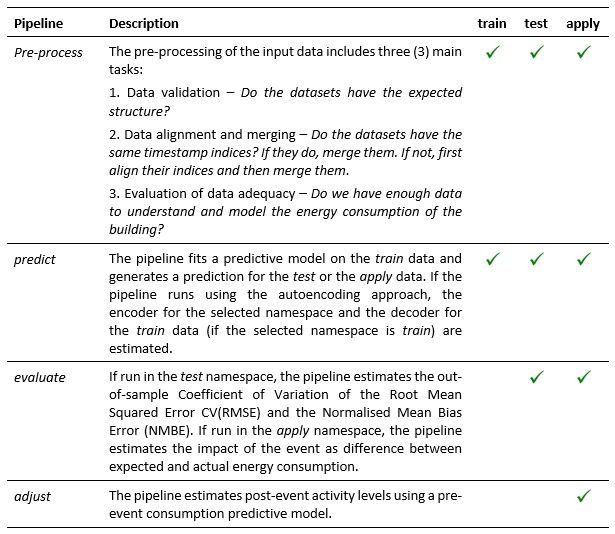
All the functionality in eensight is organised around data pipelines. Each pipeline consumes data and other artefacts (such as models) produced by a previous pipeline and produces new data and artefacts for its successor pipelines. There are four pipelines in eensight. The names of the pipelines, their descriptions, as well as the associations between pipelines and namespaces are summarised below.
More details about the eensight tool and the SENSEI methodology can be found in the online book called Rethinking Measurement and Verification of Energy Savings.