Authors:
Diego Rattazzi, Sustainability Engineer, Rina Consulting Spa.
Paolo Finocchi, Sustainable Engineer, Rina Consulting Spa.
Giorgia Spigliantini, Research and Innovation Project Manager at Rina Consulting Spa
Note: opinions in the articles are of the authors only and do not necessarily reflect the opinion of the EU.
Nomenclature

ENVISION is a H2020 EU funded project that aims to develop technologies for harvesting energy using all the available surfaces of a building. In particular, the ones not commonly used such as building façades. Different technologies have been designed, developed and tested in demo sites located all around Europe, with the aim of evaluating the performances of the systems in the field.
In all the demonstration sites, the monitored data have been collected and processed to calculate the most valuable KPIs, and these were compared with state of the art values found in the literature to calculate a normalised KPI. Depending on the obtained values of the normalised KPIs a score from 0 (worst performance) to 5 (best performance) is assigned. A score of 3/5 has been assigned to ‘state of the art’ performance. Some KPIs are specific for the single demo (e.g. the SCOP of the heat pump), while others are common to all the demos and were used to conduct a direct comparison between the technologies.
All the demos showed promising results in the social, energy, and environmental domains. For the last domain, in particular, the best results were obtained as each technology led to significant savings in GHG emissions. There is room for improvement on the economic side, which can be filled by progressively lowering the cost of technology over the years.
A dedicated methodology was performed to properly assess the performances of these systems. The KPIs are the basis for the development of the methodology implemented in this deliverable that aims to evaluate in an objective way the performance of ENVISION technologies, comparing them with state of the art and/or competitors.
The considered KPIs can be grouped in different categories as reported in Figure 1.
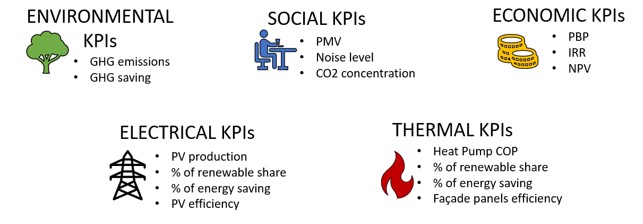
Figure 1. List of KPIs
The main ENVISION technologies are:
- Façade solar collectors coupled with a Heat Pump: This system consists of the use of solar thermal collectors to be installed on the façade of the building. These collectors collect heat and then use a water-water HP for the production of hot water with a high COP. The Façade solar collectors were produced by EMERGO, using a particular coating produced by AKZO NOBEL that makes possible the exploitation of solar radiation also in the Near Infrared (NIR) area. The overall system is then managed and assembled by TNO. The collaboration of EMERGO and TNO led to the birth of a Spin-off company named Calosol, this can be assumed to be a good result of ENVISION project.

Figure 2. ENVISION façade solar collectors
- Building Integrated PV (BIPV) Windows: This technology exploits the glazed surfaces for the generation of electrical energy. By installing PV cells between double or triple-glazed windows it is then possible to convert this passive component into a generating surface. Furthermore, the application of this system does not significantly affect the transparent behaviour required and expected from a glazed surface. The partner responsible for the development and production of this technology is NSG Pilkington.
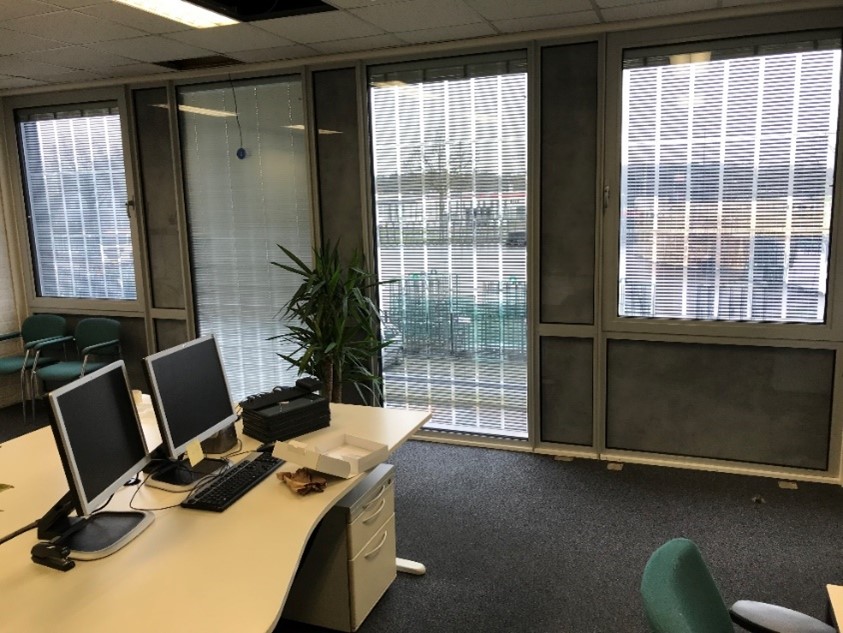
Figure 3. ENVISION BIPV Windows
The listed technologies were then tested in different demosites located all around Europe with the aim of evaluating their behaviour under different boundary conditions.
Table 1 presents the distribution of ENVISION technologies across the demosites.

Table 1. Technologies tested in different demosites
Methodology description
As mentioned, the core of the analysis described in this document is the Key Performance Indicator (KPI). Starting from the KPIs, it is possible to understand numerically how the technology performs in the tested scenarios.
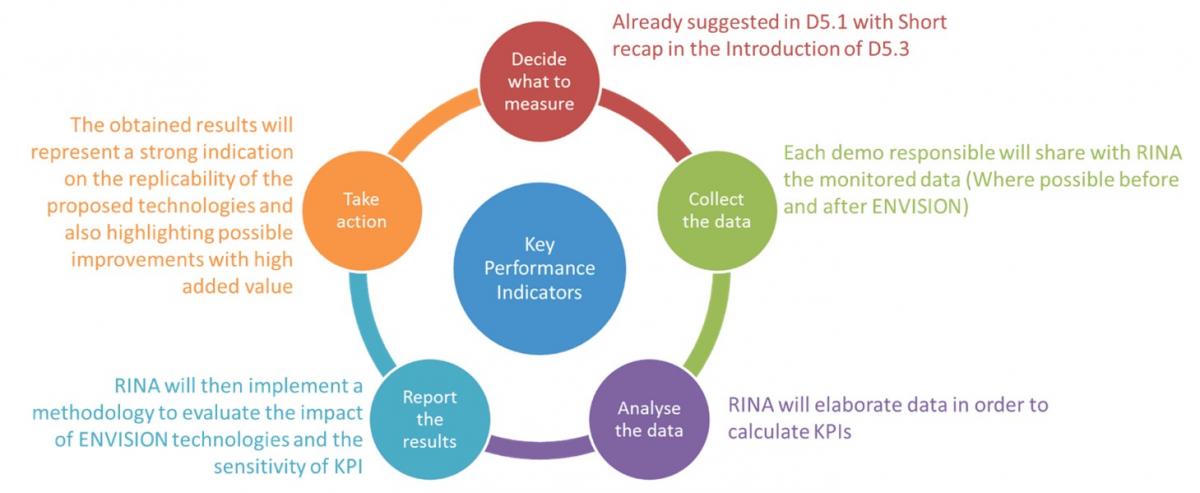 Figure 4. Concept of the presented methodology
Figure 4. summarises the concept standing behind the presented technology:
- Definition of the Needed Variables. The first step is the definition of the variables that must be collected for each of the demosites (Temperatures, mass flow rates, energy flows, etc.). The list of required variables was registered and shared with the demosite responsible to ensure that it would have been possible to collect the required data.
- Data Collection. The demo responsible was in charge of installing the proper sensors and measuring the variables for the collection of the data required. These data that was collected was mainly monitored data (directly acquired with sensors installed by demo responsible) and questionnaires submitted to building occupants for collecting their feedback on social/comfort aspects.
- Data Analysis. Starting from the variables collected in the demosites, the proper KPIs were calculated. With this in mind, specific spreadsheets were produced by RINA for the automated calculation of the KPIs.
- Results Report. This can be highlighted as the crucial phase for the proper development of the proposed assessment methodology. Considering that the KPIs have different ranges of values, it was necessary to normalise them. This normalisation was done by referring to standards and state of the art values. These reference values were obtained through literature review and research on the market. Within this process the KPIs are transformed into Normalised KPIs (N-KPIs) as shown in Figure 5.

Figure 5. KPIs Normalisation process
Once the different N-KPIs were obtained, a rate (R_(KPI^i )) was assigned to the respective i-th KPI depending on the range of values of the i-th N-KPI, as reported in Figure 6.

Figure 6. R_(KPI^i ) assignment
- Final conclusions. Making accurate considerations and conclusions on the score results could very well indicate the market potential for future applications. These analyses could, therefore, suggest to the supplier which aspect is worth investing effort into in order to reach the ambitious position on the market.
Northern Demosite
In the area of Eindhoven, two social housing corporations made houses available for the demonstration of the Envision heat collection technology. The names of these social housing corporations are Trudo (located in Eindhoven) and Compaen (located in Helmond).
Trudo’s proposal was to renovate 3 different houses of the same type located in the neighbourhood Mensfort in Eindhoven:
- 1 row dwelling north-south oriented
- 1 row dwelling south-north oriented
- 1 row dwelling at the end of the row (more energy loss)
Compaen’s proposal was to renovate 3 types of houses in 2 neighbourhoods with different renovation approaches.
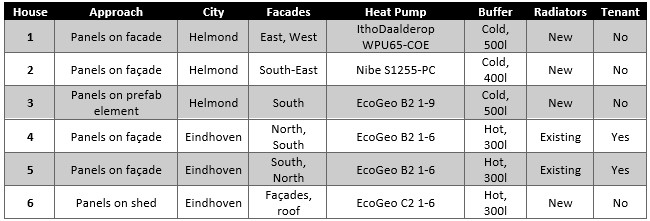
Table 2. Overview of the TNO houses characteristics
The results and the scores obtained for this demosite on average between the 6 houses are reported below regarding the energy ratings:
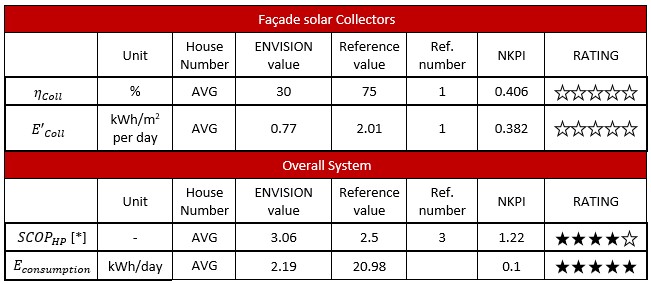
Table 3. Energy Ratings of Northern Demosite
From the performances reported in Table 3, it can be observed that the performances of the overall system are very promising. Indeed, the SCOP values are higher than the HP state of the art. Looking at the Primary Energy consumption, the impact of this system is even more evident, considering also the additional benefits related to the local generation of electricity with the local PV system that makes the houses equipped with this ENVISION solution very close to Net Zero Energy Balance.
When considering the performances of the collectors the situation becomes quite different. The efficiency of the collectors is generally far below the state of the art (75%). Of course, these values depend on the operating temperature of the collectors, as reported in Figure 7. It is worth mentioning that the main gap between the monitored values and the reference one can be due to the real operation of the system, while the reference value is obtained from a literature review. Therefore, possible shadings or other effects could affect the calculation of the efficiency.
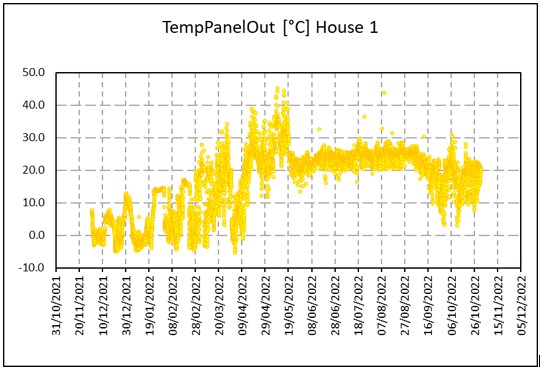
Figure 7. Solar Façade Collectors Outlet temperature for House 1
Furthermore, considering that the summer season is characterised by a lower heating demand, the HP is not used much for heating purposes, then also the energy input from the thermal collectors is not necessary.
This is confirmed by Figure 8, where it is evident that the mass flow in the solar panels (direct indication of solar collectors’ use) is zero for large part of warm season. This means that, despite the good weather conditions, there is no need of using the solar panels. Thus, the average thermal energy harvested on a daily basis strongly decreases when compared to state of the art solutions.

Figure 8. Use of Solar Façade Collectors in House 4.
The economic KPIs are reported in Table 4:

Table 4. The cconomic KPIs for Northern Demo
The results show immediately how the cost of the solar panel system is very competitive when compared to similar solutions. On the other hand, considering the economic scenario reported in Table 4, the economic savings obtained by applying this ENVISION system instead of a common standard boiler are too small when compared to the high capital costs of the system in this prototype phase.
Another category of KPIs investigated is the environmental one. On this aspect, the ENVISION system tested in Nothern Demo guarantees very promising values. Indeed, thanks to this system, the houses are Net Zero Carbon, see Table 5.
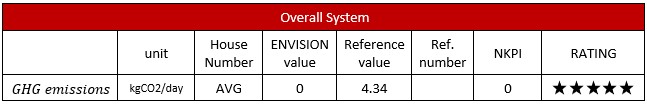
Table 5. Environmental KPIs for Northern Demo site
The last category of KPIs is the social one, aiming to collect the personal feedback of the tenants on their perception of thermal, visual, and acoustic comfort. This feedback was collected via a questionnaire filled by the tenants of the different houses.

Table 6. Final Social Ratings for Northern Demo
The values obtained are very positive with a rating above 3 on 5, meaning that the performances of the system are very appreciated by the users. Very good results are obtained also in thermal comfort, therefore it can be confrmed that the system is very well providing the heat needed by the users, both for space heating and domestic hot water. Some limitations have been detected in terms of noise level. The noise related to the recirculation pumps and the HP’s compressor can represent a source of discomfort for the users. In this sense, a solution to increase the acoustic insulation can be investigated.
As a summary, Figure 9 reports the overall ratings obtained by Northern Demo site.
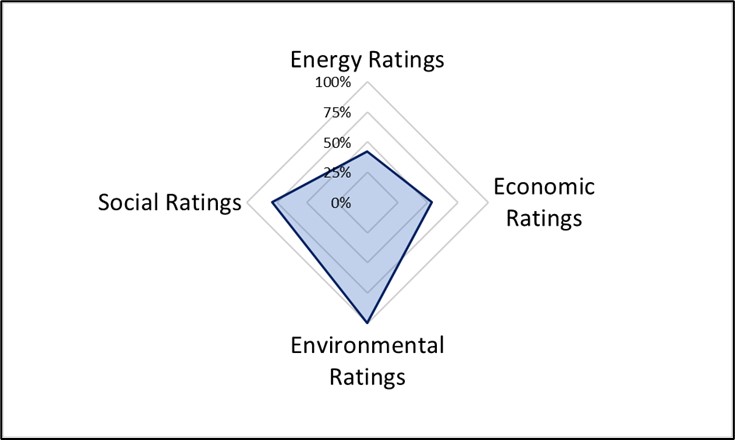
Figure 9. Overall score by categories of Northern Demo site
Pilkington Austria
This demonstration site is located in Mitterberghütten (part of Bischofshofen) at the head office of Pilkington Austria. The office building is owned by the company Techno-Z, which rents the building to several tenant companies, all working in different technical areas.
A small area of the whole building façade, where an existing aluminium glass façade was installed, was renovated with a new mullion-transom construction from Wicona. This construction consisted of a total of 63 fields (9 fields per row, 7 rows). 4 rows were equipped with PV Spandrel glasses (fully opaque modules) and 3 rows were equipped with PV Vision glasses (semi-transparent modules). Per row 3 glasses are turn-tilt windows (see Figure 10., windows with grey framing).
The whole glass area is 66.5 m2 and 7.31 kWp, consisting of 30.4 m2 PV Vision with 2.3 kWp and 36.1 m2 PV Spandrel with 5.01 kWp. The façade is nearly located towards the south (162°).
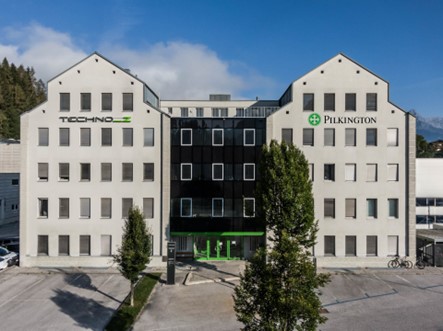
Figure 10. External view of the facade
The ratings related to energy KPIs are reported in Table 7.

Table 7. Energy KPIs result, Pilkington Austria demo
Very good results were obtained in terms of energy performance, considering results mostly above the state of the art.
Concerning the economic aspects, the BIPV technology seems to be performing less than the state of the art, as reported in Table 8.
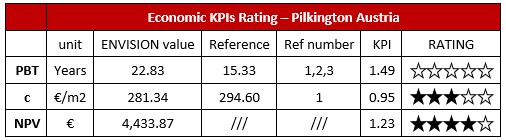
Table 8. Economic KPIs rating - Pilkington Austria demo
Considering an inflation rate equal to 2%, the investment of the installation of the whole PV façade has a Net Present Value of 4434€ in a time interval of 30 years. The PBT of the investment is around 23 years. This result, even if it leads to a low rating, is promising because in addition to the saving in the energy bill, the installed technology is expected to lead to better internal comfort due to sun shading and better insulation of the façade (and therefore a net saving in the gas bills).
Table 9, as could be expected, reports that the environmental performances are very promising since they are not associated to any emissions during their operation.
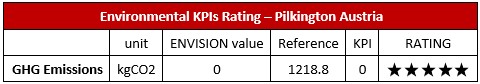
Table 9. Environmental Rating - Pilkington Austria demo
The amount of GHG emissions saved following the installation of the BIPV has been calculated, assuming that all the energy produced by the PV would otherwise have been taken from the Austrian grid. Since the PV generates no emissions on-site, every kg of CO2 due to the consumption from the grid is saved, and so the rating has been set equal to 5/5.
The result of the analysis of the social aspect is a KPI obtained through the average of all the co-efficients obtained from the answers of the employees of Pilkington’s office in Austria. The results are provided in Table 10 below:
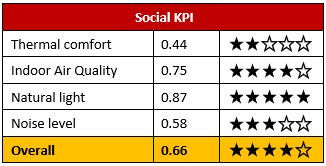
Table 10.Results of Social KPIs analysis, Pilkington Austria demo
For a general point of view, analysing the results of the various categories of KPI together, it is possible to see how well this demo performed from an environmental point of view. The results from both the economic and energy aspects are also encouraging, especially in view of a gradual decrease in technology costs and an expected increase in electricity prices. As mentioned above, in addition to the savings from self-consumption, there are also savings on both winter and summer air conditioning. All the employees reported discomfort related to the high temperatures in the room, while for the other aspects of the questionnaire positive responses were collected.

Figure 11. Overall score by categories, Pilkington Austria
Conclusions
After the detailed analyses presented in the sections above, it is reasonable to state that all the demos showed strengths and weaknesses, but overall, they satisfied the expectation in terms of performance. All the demos show overall ratings higher than the SoA.
Generally speaking, the environmental domain is by far the one where the ENVISION technologies are performing best since in all the demos the renovation is leading to a consistent CO2 saving. On the other side, the most critical domain is the economic one, due to the high capital cost of the technology in this prototype phase. The increasing cost of energy and the progressively decreasing cost of the technology due to a higher level of technology maturity will offer the possibility for better investments.