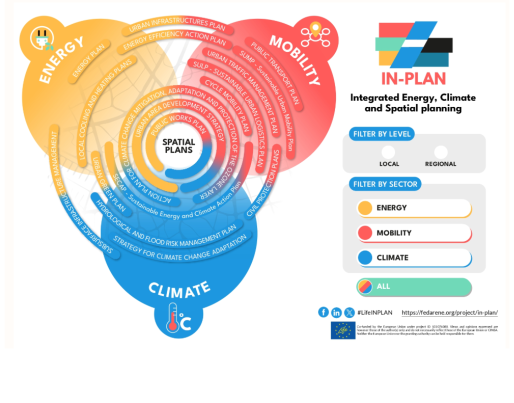
IN-PLAN Spatial Plans Infographic

IN-PLAN Spatial Plans Infographic
In a rapidly evolving world, where climate challenges are more pressing than ever, the integration of energy, climate, and spatial planning has become a cornerstone for sustainable development. IN-PLAN is at the forefront of this transformative journey, offering a comprehensive blueprint to harmonize these critical sectors.
In this framework, the IN-PLAN project developed a new interactive infographic to help cities and regions create more sustainable and resilient urban planning strategies while highlighting the interconnections of different sectors.
The interactive infographic of IN-PLAN, developed after an analysis of the existing plans in its six focus countries, serves as a visual guide, revealing the complex relationships between various planning documents. By mapping out the intersections and overlaps between sectoral plans, the tool empowers policymakers and planners to identify potential synergies, conflicts, and areas for harmonization.
One of the greatest challenges in integrated planning is understanding how seemingly disparate plans can impact one another. IN-PLAN’s infographic is invaluable in this regard, as it helps us to visualize the interconnections between energy, climate, and spatial planning, and to identify opportunities for more coherent and effective decision-making. Users can indeed explore different sectors, such as energy, mobility, and climate, and filter by level, including local and regional scales.
The tool’s ability to direct planners towards relevant sectoral plans and to analyse the coherence of their forecasts is a significant step forward in the pursuit of integrated planning. By fostering a more holistic approach, IN-PLAN can help regions and localities develop more sustainable, resilient, and equitable urban environments.
By visualizing the complex relationships between these elements, the tool empowers policymakers and planners to make informed decisions that promote energy efficiency, reduce greenhouse gas emissions, and improve the quality of life for urban residents.
IN-PLAN_SPATIAL-PLANS.pdf
English (2.06 MB - PDF)