Introduction
The building sector is responsible for a significant amount of greenhouse gas (GHG) emissions, with the residential sector being the second largest contributor to final energy consumption in the European Union after the transport sector. The EU has set goals to reduce GHG emissions by 20% in 2020, by 40% in 2030, and by 80-95% in 2050 [1]. Sweden also has ambitious targets for energy and GHG reductions, with a goal of zero net emissions by 2045 [2]. Despite being a role-model in tackling climate change, Sweden’s building sector has a lower energy index than the EU average, and a large number of buildings need renovation.
Renovating existing buildings is crucial for reducing GHG emissions and achieving energy efficiency, but the current renovation rate in Europe is low, with only 11% of buildings being renovated per year. The deep energy-related renovation that reduces energy consumption by 60% is performed in only 0.2% of buildings per year. The European Commission aims to double the current renovation rate by 2030. The Million Homes Programme in Sweden constructed many residential buildings between 1965 and 1975, which are now in need of renovation. However, there is a risk of retrofitting buildings in the wrong way, leading to a lock-in effect and hindering further energy improvements.
Challenges that the project seeks to address
Building renovation is a crucial step towards achieving energy efficiency goals. However, there are several challenges and uncertainties that can cause renovations to fail to deliver the expected results. One major challenge is the energy-efficiency gap, where potential improvements to redirect energy demand may seem cost-effective but are not the optimal solution. This phenomenon can lead to a lock-in effect, where further improvements are blocked until the next renovation cycle [3].
Another challenge is the uncertainty in simulation and renovation, where the energy reduction is less than predicted due to inaccuracies or uncertainties in the building simulation models. Input parameters such as geometry, boundary conditions [4], occupants’ behaviour [5], and financial calculations can lead to wrong conclusions in the selection of the best renovation scenario [6]. Even life cycle cost analysis (LCCA) can present uncertainties in parameters such as average cost [7] and expected lifetime for building elements [8, 9], discount rate [8, 10], and calculation period [11]. This presents a challenge, especially for items with a shorter lifespan than the calculation period.
To address these challenges, a workflow is proposed that will later be implemented in a tool using AI allowing automated assessment of residential buildings with the minimum level of intervention. The working method is presented in its basic form in this study, with plans for later phases of the project, which will integrate the views of stakeholders such as building owners on how to deliver results in a meaningful way so that they can be implemented and how to show the benefits of renovation.
The working method
The methodology is based on three main stages as it can be seen in Figure 1. First, the energy certificates, costs, and LCA database are analysed. The geometry of the building is analysed using available images, e.g., from Google Street View, and machine learning (ML) algorithms are employed to automatically generate thermal 3D models including windows, doors, and balconies for the simulation. Parameters and data are detected to describe the current building conditions and the elaboration of renovation scenarios. The second step is to develop a workflow in Rhino/Grasshopper/EnergyPlus to model a residential building automatically and feed the simulation model with data obtained from the databases. Finally, a simulation campaign is carried out to obtain an optimal renovation package, minimising energy consumption and environmental impact.
A case study on a building was carried out in Uddevalla, Sweden. The building is part of a residential area built between 1965 and 1975 with approximately 750 dwellings. The building is a four-story building with a basement, constructed mainly with precast concrete and heated by district heating. It was renovated in 2020, focusing on reducing the energy demand for heating. Improvements were made to the insulation in walls, floors, and roof, as well as window replacement. Several measurements, including energy consumption data before and after renovation, were used to validate the proposed method.
Step 1
In Step 1, a renovation catalogue was created based on studies carried out on buildings constructed in the Million Homes Programme. Once the different renovation proposals were defined, a database of costs and embodied carbon of each material was created. An LCA was carried out to calculate the embodied emissions of the design measures studied. The calculation considers the initial phases of the life cycle, from raw material extraction to manufacturing (A1-A3), according to the European standard SS-EN15978:2011. The technical lifetime of the buildings was determined based on the value year, which is an estimation of the equivalent age for taxation. For the lifetime of the measures, the Boverket's Climate Declaration [12] material database was used. The cost for the materials was collected from Wikells byggberäkningar [13], a standard reference from the local building industry.
Step 2
In Step 2, a simulation campaign was carried out to calibrate the baseline model and to obtain a sensitivity analysis. As a reference, the measured heating energy demand during 2017, prior to the building renovation in 2020, was used. The simulations focused on determining the most uncertain parameters of the building, such as ventilation and air tightness. The rest of the parameters were known not from measurements but from field verification during the renovation work, such as insulation levels and the condition of the windows. The Monte Carlo method was used for calibration, and Morris’s method and a regression were also utilised.
Step 3
In Step 3, a workflow was developed between Rhino/Grasshopper/Octopus/EnergyPlus to automate the optimisation campaign in connection with the cost database. To obtain the geometrical model of the building, a CAD file was used, which shows the floor plan of the building. Then in Rhino, each level is automatically modelled according to the limits assigned to the drawing, such as height, number of floors, etc. The model is exported to Grasshopper, and a thermal model of the building is generated, where the materials, conditions of use, schedules, etc. are assigned.
At this stage of the process, the databases are also incorporated as a CSV file, which Grasshopper reads and assigns to each simulation. The script is designed in such a way that the improvements that are assigned to the building can be done randomly for each component, floor, wall, roof, etc. The next tool is Octopus, which performs the optimisation between LCC and LCA. It basically manages the results and sends to Grasshopper the list of the next simulations to be performed always in the direction of minimising both variables.
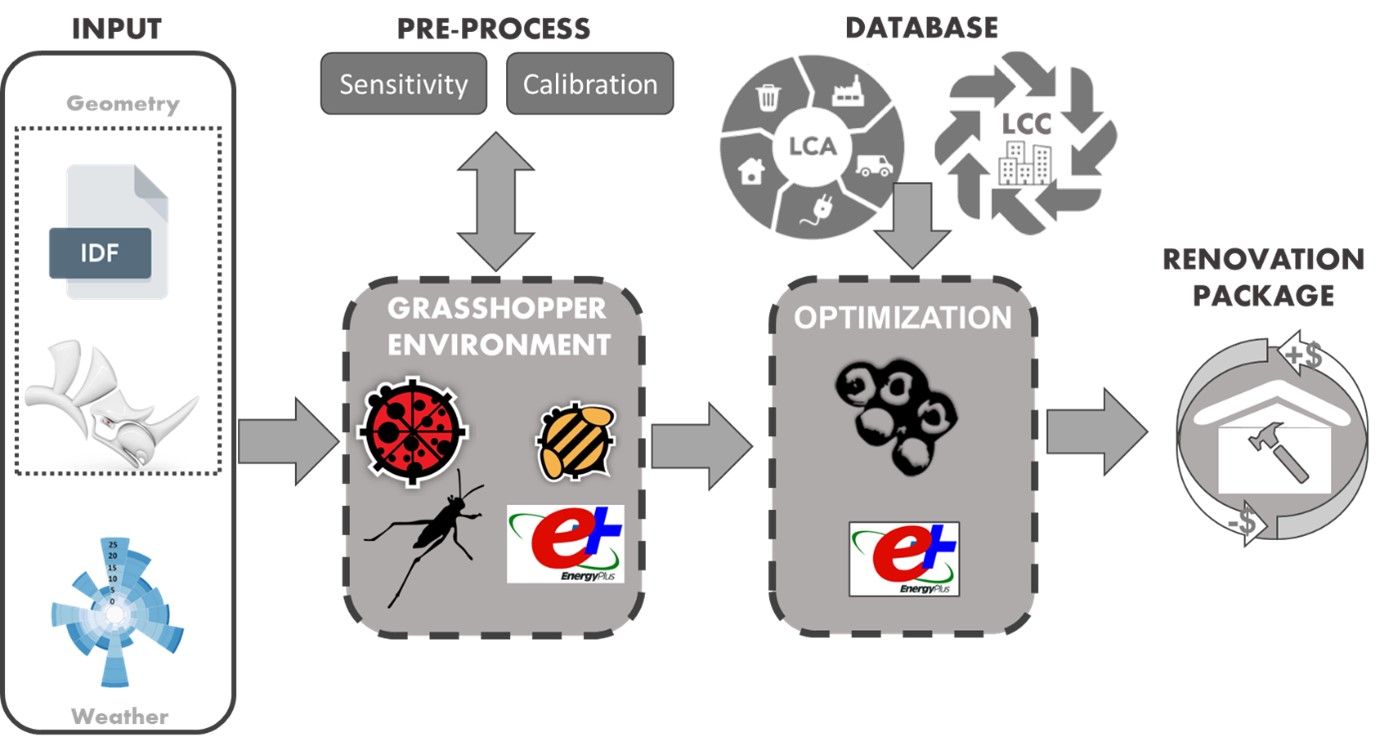
Figure 1. The methodology implemented in the workflow consists of 3 stages of analysis, pre-processing, optimisation, and results in a renovation package.
Results
Data base
The databases, which can be seen in Table 1, consider materials rather than complete component solutions. Each material was sourced from scientific articles proposing renovation solutions to buildings constructed under the Million Homes Programme. Then in the optimisation phase, a solution is randomly created for floor, wall, roof, and window. The solutions vary in the number of layers they can have, the maximum number of layers of the renovation solutions correspond to the maximum number of layers that were used in the selected studies.
Table 1. Materials database.
|
Material
|
Conductivity
|
Cost
|
Embodied carbon
|
Density
|
|
W/m*K
|
SEK
|
kg CO₂e/kg
|
kg/m³
|
|
Mineral wool
|
0.038
|
38.0
|
1.61
|
300
|
|
Polystyrene with skin
|
0.04
|
81.2
|
4.0
|
250
|
|
Rock wool façade
|
0.02
|
53.2
|
1.61
|
80
|
|
Rock wool roof
|
0.02
|
53.2
|
1.61
|
180
|
|
Wood fibre
|
0.038
|
56.5
|
0.371
|
50
|
|
Glass wool
|
0.042
|
167.2
|
1.13
|
15
|
|
Expanded clay aggregate insulation
|
0.07
|
88.9
|
0.243
|
400
|
|
Plasterboard
|
0.4
|
60.6
|
0.333
|
760
|
|
Gypsum board
|
0.21
|
39.4
|
0.333
|
760
|
|
Particle board
|
0.1
|
113.0
|
0.488
|
300
|
|
Gypsum fireboard MDF
|
0.07
|
102.0
|
0.32
|
250
|
|
Gypsum floorboard
|
0.43
|
60.6
|
0.296
|
1120
|
|
Cement fibreboard construction board
|
0.25
|
281.0
|
0.849
|
1080
|
|
OSB
|
0.13
|
220.9
|
0.448
|
607
|
|
light weight Concrete
|
0.1
|
550.3
|
0.291
|
1360
|
|
Plywood
|
0.09
|
340.0
|
0.448
|
460
|
|
Window wood/aluminium inward 3-glass (U-value)
|
1.1
|
6979.0
|
2.5
|
40
|
|
Window wood inward 3-glass (U-value)
|
0.85
|
4967.0
|
2.13
|
36
|
|
Window wood fixed 3-glass (U-value)
|
0.80
|
3816.0
|
2.13
|
35
|
|
Window wood/aluminium side hung 3-glass (U-value)
|
0.60
|
7627.0
|
2.88
|
39
|
Sensitivity analysis
A total of 698 simulations were performed with random variations in the parameters within the selected limit ranges. According to the results of the Morris method, the most influential parameters in the simulation are ventilation and infiltration, which are the only unknown parameters. According to Figure 2, ventilation is an influential parameter in the accuracy of the energy demand estimation. However, it has a high value in the standard deviation, which indicates that possible interactions with other variables and/or that the variable has a non-linear effect on the output. In the case of infiltration, the calculated value of μ shows that it is a sensitive value but its dependence on the other parameters is less than in the case of ventilation.
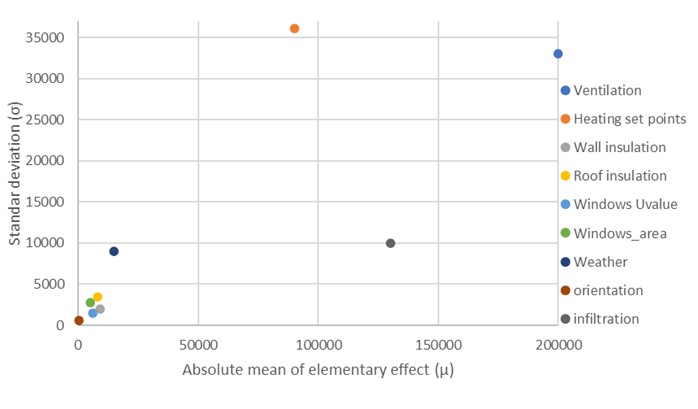
Figure 2. Results of the Morris method.
Calibration
The calibration seeks to adjust the energy demand through the iteration of the unknown parameters, in this case the ventilation and air infiltration flow rates. According to the results of the sensitivity analysis, these parameters are the most influential in the simulation. In order to reduce the uncertainty in the results, all parameters were randomised, and the results that were close to the measured energy demand, 176888 kWh, were revised.
According to the results, the air infiltration at 50Pa, the value most likely to be correct is 3.5 ACH, since most of the simulations are in a range close to the measured energy demand values. Almost similar is the case for ventilation, although as the sensitivity analysis showed, the ventilation energy demand is dependent on its interaction with other parameters. This is consistent with the results, as it has a higher dispersion than infiltration. The ventilation flow rate that coincides most often with the measurements and has the smallest dispersion range is 0.5 ACH. Both results can be seen in Figure 3.
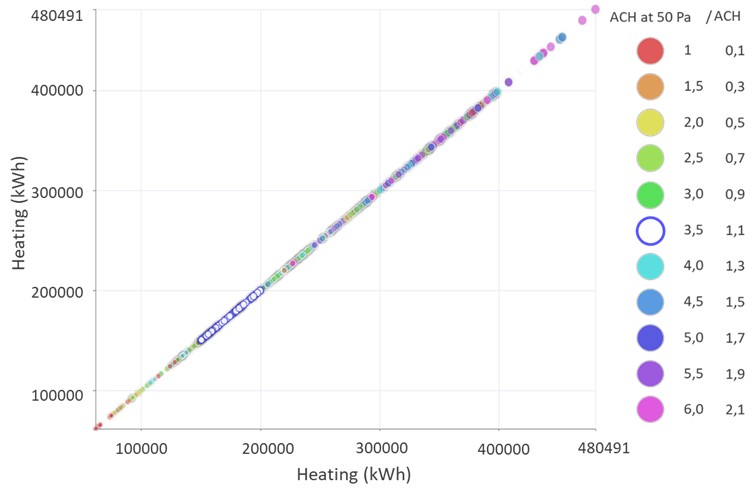
Figure 3. Shows the distribution of the results of the random simulations, where the infiltration at 3.5 and ventilation at 0.5 ACH are the best fit to the measurements.
Optimisation
The optimisation results show that there are different options for renovating the building depending on the main variable to be minimised, cost or GHG emissions. If we consider the results that minimise both, the solutions show that the energy demand can be reduced by 35.5%. While in the LCA, the embodied carbon represents 35.3% while GHG emissions due to operation represents 64.7%. The optimisation shows that two layers is the optimal number between LCA and LCC. The materials that appear in the optimal solutions vary depending on the component. For walls, the use of rock wool and plasterboard was the most efficient. While for the ceiling, wood fibre and gypsum board performed best, for the windows, triple glazing was the best option. The details of the results of the simulations in the optimisation stage can be seen in the Figure 4.
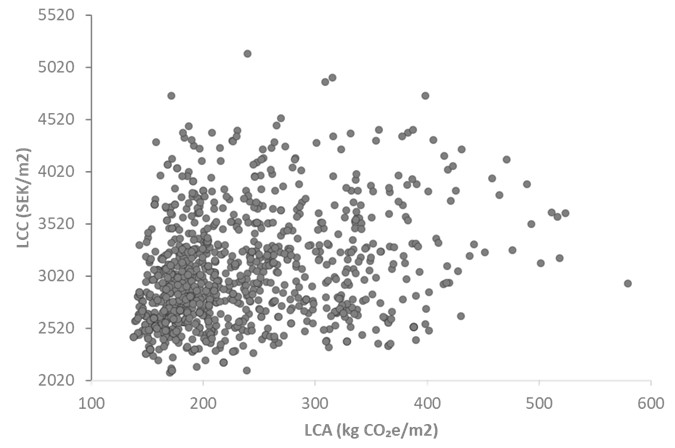
Figure 4. Simulation results for life cycle costs and life cycle GHG emissions during the optimisation campaign.
However, the results allow to propose renovation measures in residential buildings in an automated way. Some manual adjustments are required when some parameters are unknown, such as airtightness and ventilation levels in our case. However, the incorporation of calibration into the automated workflow is part of this project in the future.
Another important factor to note is that the CAD file must contain the three-dimensional information of the building, i.e., the number of floors and window heights. As mentioned above, the building was already renovated in 2020. Measurements show that it reduced its energy consumption by 16% by making improvements of the same size excluding the ground floor. Although the 2020 climate is different from the simulation, the difference is substantial compared to the calculated optimal solution, which predicts an energy reduction of 35.5%. In the next phase of the study, a comparison will be made with year-specific climates to verify the differences between the two solutions, in terms of energy and embodied emissions.
Feedback from the stakeholders
From the feedback obtained from the different stakeholders, the aim of the DecarbonAIte project of providing a new tool to help assess building renovations seems to be valuable and useful. This tool could be used by different stakeholders for a variety of tasks. For example, tools can be used to assist with tasks such as renovation planning, energy simulations, and predicting the performance of buildings or local districts, which can be used for municipalities and energy providers and building owners.
However, introducing the concepts of LCA, LCC, and energy performance calculation to stakeholders, especially building owners, is new and can be challenging. It is important to consider the impact of different renovation alternatives on carbon emissions by considering the selection of construction concepts and materials, whether new or re-used.
DecarbonAIte's approach is holistic and valuable. However, one challenge is to make the tool user-friendly, the project needs stakeholder input to create a concept tool that is easy to use and understand. It's also essential to help stakeholders understand when to use the DecarbonAIte tools versus commercial tools for calculating energy performance or climate impact LCA.
Conclusion
The proposed methodology allows for automated assessment of residential buildings in Sweden, using LCC and LCA to derive optimal renovation solutions. The results demonstrate that there are multiple options for optimising buildings based on cost or emissions, allowing stakeholders to decide which indicator best represents their benefits. The feedback obtained suggests that a user-friendly platform and visualisation model are necessary for users to understand the results. In the next stage of the project, the usability of the tool and its potential impact on traditional methods and tools currently used in planning renovation tasks will be tested with target users. While manual adjustments may still be required for unknown parameters, the proposed methodology offers a promising approach for large scale building renovation potential assessments.
References
- European Commission, Communication from the Commission to the European Parliament, the Council, the European Economic and Social Committee and the Committee of the Regions, A Roadmap for moving to a competitive low carbon economy in 2050. 2011, European Commission: Brussels. p. 15.
- Ministry of the Environment, Sweden’s long-term strategy for reducing greenhouse gas emissions. 2020, Government Offices of Sweden.
- Blomqvist, S., W. Glad, and P. Rohdin, Ten years of energy efficiency—Exploring the progress of barriers and drivers in the swedish residential and services sector. Energy Reports, 2022. 8: p. 14726-14740.
- de Wilde, P., The gap between predicted and measured energy performance of buildings: A framework for investigation. Automation in Construction, 2014. 41: p. 40-49.
- Stoppel, C.M. and F. Leite, Evaluating building energy model performance of LEED buildings: Identifying potential sources of error through aggregate analysis. Energy and Buildings, 2013. 65: p. 185-196.
- Kuivjõgi, H., et al., Market based renovation solutions in non-residential buildings – Why commercial buildings are not renovated to NZEB. Energy and Buildings, 2021. 248: p. 111169.
- Morrissey, J. and R.E. Horne, Life cycle cost implications of energy efficiency measures in new residential buildings. Energy and Buildings, 2011. 43(4): p. 915-924.
- Ruparathna, R., K. Hewage, and R. Sadiq, Economic evaluation of building energy retrofits: A fuzzy based approach. Energy and Buildings, 2017. 139: p. 395-406.
- Pombo, O., B. Rivela, and J. Neila, The challenge of sustainable building renovation: assessment of current criteria and future outlook. Journal of Cleaner Production, 2016. 123: p. 88-100.
- Islam, H., M. Jollands, and S. Setunge, Life cycle assessment and life cycle cost implication of residential buildings—A review. Renewable and Sustainable Energy Reviews, 2015. 42: p. 129-140.
- Ferreira, M., M. Almeida, and A. Rodrigues, Cost-optimal energy efficiency levels are the first step in achieving cost effective renovation in residential buildings with a nearly-zero energy target. Energy and Buildings, 2016. 133: p. 724-737.
- The Swedish National Board of Housing Building and Planning. Climate declaration for new buildings. 2023 2023-04-09]; Available from: https://www.boverket.se/en/start/building-in-sweden/contractor/tendering-process/climate-declaration/.
- Wikells byggberäkningar. Tillsammans bygger vi affärer. 2023 2023-04-29]; Available from: https://wikells.se/.


