Introduction
Construction is widely recognised as one of the largest consumers of materials and generators of waste in the world, with estimates suggesting that the construction industry accounts for up to 40% of global energy use, 30% of greenhouse gas emissions, and 50% of raw material consumption [1]. To face these impacts and address climate crisis, Circular Economy (CE) has become an exciting disruptive model.
Houseful is a Horizon 2020 project aimed at developing technological solutions and business models for the creation of sustainable and highly energy efficient residential buildings. To do so, it counted with the participation of multiple companies and organisations across different European countries, focused on the key areas of energy efficiency in building construction and operation, integration of renewable energies, management of energy and water, and use of sustainable and circular materials. In short, the Houseful project aims to transform the way in which residential buildings are built and operate in Europe, promoting a transition towards a low carbon economy while improving the quality of life of citizens.
Within the holistic solutions of the project, is found the development of a Building Circularity Methodology (BCM) to evaluate the efficiency of Circular Economy solutions for the housing sector. The methodology, aligned with Level(s) framework [2] of core sustainability indicators and the horizontal standards on building sustainability, assesses the circularity according to six CE pillars by evaluating Key Performance Indicators (KPIs) from a life cycle perspective (from materials extraction to end-of-life actions). These are flow analysis indicators for main natural resources used in building construction activities (energy, water, and materials) and impact indicators for the Sustainability aspects (social, environmental, and economic impacts). In order to best represent the circularity of each of these pillars, the methodology also relies on other references such as the BREEAM certification or the Ellen MacArthur foundation [3]. With this approach, the most relevant aspects of CE in the building construction activities [4][5][6], i.e., the relevant CE pillars, are tackled.
The proposed methodological approach is shown in Figure 1.0., and consists of three main calculation steps:
- Calculation of six CE pillars Key Performance Indicators (KPIs), the Circularity indicators
- Adjustment of Circularity indicators to weigh the building performance in each pillar
- Adjustment of weighed Circularity Indicators to incorporate the regional characteristics and relevance of each pillar to obtain the final Building Circularity Score (BCS), a metric allowing comparison of designs considering the different needs in each country.
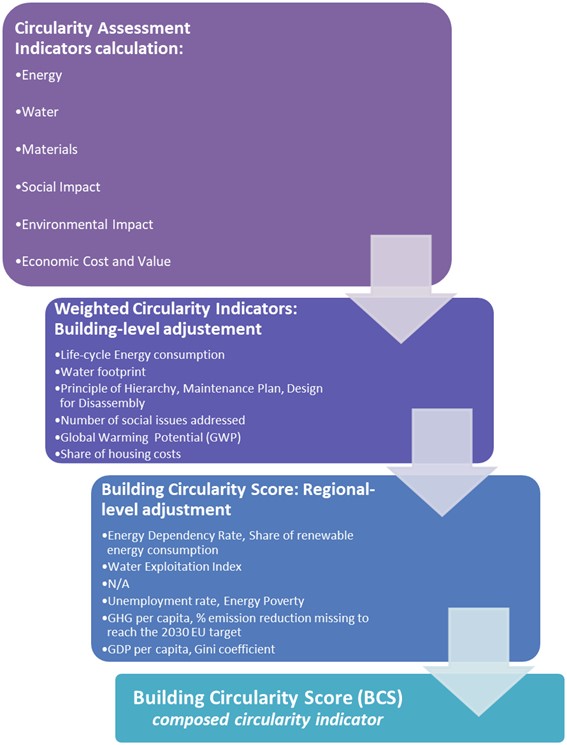
Figure 1.0 The Building Circularity Methodology (BCM) overall approach
Circular Economy pillars assessment
The methodology aims at assessing the Circular Economy performance of a building construction or renovation project tackling the six abovementioned pillars: Energy, Water and Materials flows and Social, Environmental and Economic impacts.
Energy
For Energy, the focus aimed to guarantee improvements of the energy circularity in buildings, represented by:
- How much renewable energy is used to manufacture the project’s products (known as embedded energy).
- How much energy is saved and how much renewable energy is generated and self-consumed during the construction and operation stages, both at building level and nearby, in close alignment with the current Energy Performance Building Directive (EPBD).
- And finally, how much energy is needed to deconstruct and for treatment of the waste.
This analysis encompasses how the energy is used during the building’s lifetime and estimates its degree of circularity.
Water
For the Water pillar, the embodied water of the building's products, the water consumed during construction, and the water recuperated and reused during operation is considered. The amount of water required for deconstruction and waste treatment is also taken into account. The water circularity arises from:
- Water saving measures implemented in each life cycle stage.
- Greywater and rainwater cycling systems.
Material
In the Material pillar, circularity is measured in accordance with:
- The amount of recyclable content in building products and parts.
- The use of reused products and components
- Construction and demolition waste (C&DW) minimisation
- The proportion of material recycled or reused during the end-of-life stage and on parts replacement and maintenance.
These cycled materials assessment enables material circularity measurement throughout the building lifecycle.
Social
The Social indicator focuses on the well-being of building users and the respect for production, construction, and waste treatment practices that improve social fairness. It is based on a list of social requirements that are established by frameworks and certifications such as Level(s), LEED, WELL, or Cradle to Cradle.
Environmental
The Environmental indicator considers the entire life cycle of the building and compares the greenhouse gas emissions of the building with and without the use of the CE solutions. This provides a comprehensive understanding of the environmental impact reduction of the building as a result of CE solutions implementation.
Economic
Finally, the Economic indicator analyses the economic impact of the implemented solutions. It compares the Life Cycle Costing (LCC) of the building with and without the CE solutions, taking into account factors such as maintenance costs and energy and water savings.
Global indicator and adjustment factors
In order to simplify the analysis and to obtain a common indicator allowing an easy comparison between several projects, the Houseful methodology proposes to calculate a global circularity indicator [6], the Building Circularity Score (BCS), from the indicators presented above.
To take into account the specificities of the different buildings and to propose an indicator that considers the context, adjustment factors are applied to the six indicators to obtain the global indicator.
The first adjustment is based on the building stock of the country in which the building is located. This step is crucial to correctly reflect any mismatch between the degree of circularity and the general characteristics of the country's building stock. For example, if a building with a high circularity energy indicator has a higher consumption than the average building stock, the indicator will be penalised, despite having a high degree of energy that can be considered circular.
The second and final step in obtaining the overall indicator is the consideration of the stress in each CE pillar found in the regional context where the building is constructed or renovated. This step is important to reflect the different relevance of implementing CE measures addressing one pillar on another in the different countries, and to weigh in such relevance to the BCS by increasing or decreasing pillar relevance. For example, for a country with great energy availability but suffering from water stress (such as Spain), the water indicator will have a higher weight than energy in the calculation of the overall indicator.
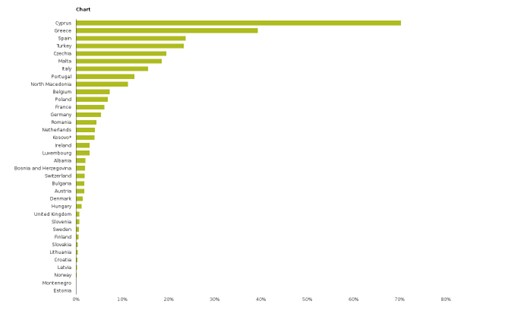
Figure 2.0 Water exploitation index [7]
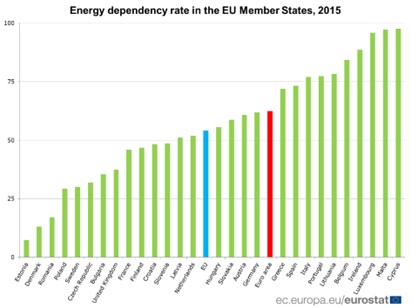
Figure 3.0 Energy dependency rate [8][9]
First application and results
Within the Houseful project a first application of the methodology is carried out on demonstration buildings [10]. In each of these buildings a set of solutions proposed by the Houseful project has been implemented and the use of the methodology aims to obtain and analyse the results obtained from real data.
Table 1.0 Building Circularity Indicators obtained in a real case scenario
|
Circularity indicator ratios [%] and values
|
Indicator
|
Energy Circularity Indicator
|
Water Circularity Indicator
|
Materials Circularity Indicator
|
Social Circularity Indicator
|
Environmental Impact Reduction
|
Life cycle cost reduction
|
|
Total
|
0.40
|
0.18
|
0.049
|
0.31
|
-
|
-
|
|
Global indicator
|
0.23
|
There is a large difference between the indicators, with the main difference being the low value of the material circularity indicator. This is explained by the circularity conditions considered. In this first application, only the input of materials from recycling and the output of materials destined to be recycled are categorised as circular, and materials from renewable sources (bio-based materials such as timber or cork) are not considered as circular if they are not fully recyclable or reusable.
The energy and water circularity indicators are higher thanks to efficient solutions allowing important savings. Energy savings are achieved through external insulation and water savings through a greywater harvesting system with plant-based filtration.
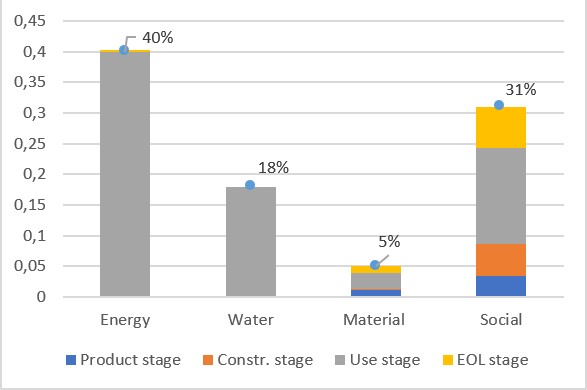
Figure 4.0 Building Circularity Indicators’ results in a real-case scenario
Figure 4.0 illustrates the relative contribution of each life stage to the overall indicators. Notably, for energy and water, the use phase exerts a significant influence, such that the impact of the other phases is negligible. This result can be attributed to a consumption rate that far exceeds the embodied energy and water in the products used. In contrast, the distribution of material impacts is more equitable, as each phase is solely dependent on the input and output of materials that have comparable magnitudes.
Finally, the application of the second adjustment factor allows us to weigh the indicators to obtain the global indicator.
Table 2.0 Circularity Indicators and adjustment process in a real-case scenario
|
Circularity Pillar
|
Weighted Value
|
Scatter factor (normalized)
|
Weighted circularity
|
|
Energy
|
40%
|
0,12
|
5%
|
|
Water
|
18%
|
0,30
|
5%
|
|
Material
|
5%
|
0,30
|
2%
|
|
Social
|
31%
|
0,27
|
8%
|
|
Global indicator
|
24%
|
1,00
|
20%
|
The use of the second adjustment factor results in a reduction of the building's overall circularity indicator. This outcome can be attributed to the low value of the material circularity indicator. The adjustment factor reduces the weight of indicators with high values, such as the energy indicator, which gives more weight to the material indicator. Consequently, the global indicator is lower. This effect is further accentuated by the non-inclusion of environmental and economic indicators, which would increase the weight of the material indicator.
The Building Circularity Tool (CT), a Decision-Support System (DSS) for building construction and renovation projects
To ease the process of input data gathering and methodology application, the BCM has been implemented in the so-called Building Circularity Tool (CT), a web-based tool that allows connection with pre-existing building products and components databases and automatic calculation of all indicators, per pillar and life cycle stage, and the combined BCS. Such a tool is intended to be a Decision-Support System (DSS) for building designers, architects, engineers, policymakers, and even financing institutions, with is being possible to use the BCS as a mechanism to address compliance with CE principles and the EU Taxonomy to access favourable financing mechanisms.
The application and use of the methodology is subject to limitations. Data availability is a primary limitation, as some inputs are not always accessible and must be estimated with varying degrees of confidence. Anticipation of needs is important for efficiency, as many tasks are interdependent and use the results of previous tasks. The list of data required for the methodology must be mastered by all stakeholders to ensure the coverage of all data.
Conclusion
This article introduces an innovative approach aimed at assessing the extent to which Circular Economy (CE) principles are applied in the building sector. The proposed evaluation methodology assesses the efficiency of the implementation of CE practices in new or refurbished buildings. Given the significant resource utilisation, such as materials, energy and water throughout the life cycle of buildings, circular solutions offer substantial potential for generating social, environmental, and economic value. This methodology further incorporates an assessment of the economic value throughout the life cycle, encompassing the consideration of both positive and negative externalities. The development of this methodology holds considerable significance for stakeholders in the building and construction sector, primarily due to the current low availability of evaluation methodologies and indicators in this domain.
To evaluate the circularity of buildings, five key factors within the Circular Economy framework have been identified as pertinent: energy consumption, materials usage, water consumption, social added value, and life cycle economic value. These indicators are firstly treated individually through five distinct metrics. Subsequently, the indicators mentioned previously are consolidated into a singular indicator, which reflects the overall level of circularity for a given building. This general indicator is derived through a weighted average calculation, whereby the weights assigned to each indicator correspond to the level of emphasis placed on them within the specific country where the building is situated.
First results have been obtained through the application of the methodology to pilot buildings of the Houseful project. Notably, one of the noteworthy outcomes reveals the significant influence of the operational phase on the water and energy indicators. Nevertheless, the implementation of the methodology has also brought attention to certain limitations associated with its utilisation, the main ones being the lack of data and the difficulty of communication between stakeholders. To effectively employ the methodology, it is imperative to anticipate these limitations and engage all stakeholders proactively, thereby streamlining the process of data collection.
References
- Huerta Carrascosa, D., Perero van Hove, E., Bolea, J., Tertre Toran, J. I., & Ronquillo Muñoz, L. (2018). Grupo de trabajo GT-6 Congreso Nacional del Medio Ambiente 2018 Fundación Conama. Madrid, Spain. Retrieved from http://www.conama.org/conama/download/files/conama2018//GTs2018/6_preliminar.pdf
- Dodd, N., Cordella, M., Traverso, M., & Donatello, S. (2017a). Level(s) – A common EU framework of core sustainability indicators for office and residential buildings: Part 3: How to make performance assessments using Level(s) (Beta v1.0) | EU Science Hub. Sevilla, Spain. https://doi.org/10.2760/95143
- Ellen Macarthur Foundation. n.d. https://ellenmacarthurfoundation.org/circular-economy-diagram
- Kubbinga, B., Bamberger, M., van Noort, E., van den Reek, D., Blok, M., Roemers, G., … Faes, K. (2018). A Framework for Circular Buildings. Amsterdam, The Netherlands. Retrieved from https://www.dgbc.nl/upload/files/Circulariteit/AFramework-For-Circular-Buildings-BREEAM-report-English.pdf
- González, A., Sendra, C., Herena, A., Rosquillas, M., & Vaz, D. (2021). Methodology to assess the circularity in building construction and refurbishment activities. Resources, Conservation & Recycling Advances, 12, 200051. https://doi.org/10.1016/j.rcradv.2021.200051
- González, A., Herena, A., & Surroca, Vincent. (n.d.). D2.6 Description of the BCM methodology and implementation rules in real scenarios.
- Agency, European Environment. Water scarcity conditions as measured using the water exploitation index plus (WEI+), by country, 2017. n.d. https://www.eea.europa.eu/data-and-maps/daviz/development-of-the-water-exploitation#tab-chart_1
- EUROSTAT. (2020). Energy Dependency Rate - Eurostat. Luxembourg, Luxembourg: EUROSTAT the statistical office of the European Union. Retrieved from https://ec.europa.eu/eurostat/databrowser/view/t2020_rd320/default/table?lang=en
- EUROSTAT. (2017). More than half the energy the EU uses comes from imports. Luxembourg, Luxembourg: EUROSTAT the statistical office of the European Union. Retrieved from https://ec.europa.eu/eurostat/web/products-eurostat-news/-/DDN-20170220-1
- Houseful. (2023). Demos. http://houseful.eu/demos/


